
 by
A Brand Lift study helps you measure how advertising affects perceptions of your brand. You ask two groups of users the same question and compare their answers. The first group includes users who were eligible to see your campaign ads. The second is a control group whose members were excluded from seeing those ads.
1. Enable Brand Lift in your main campaign
1. In your campaign settings, open the Brand Lift section.
2. Turn on the Brand Lift enabled toggle.
3. Enter the percentage of users to set aside for the control group. The recommended setting is 20%.
4. Save your settings and launch the campaign.
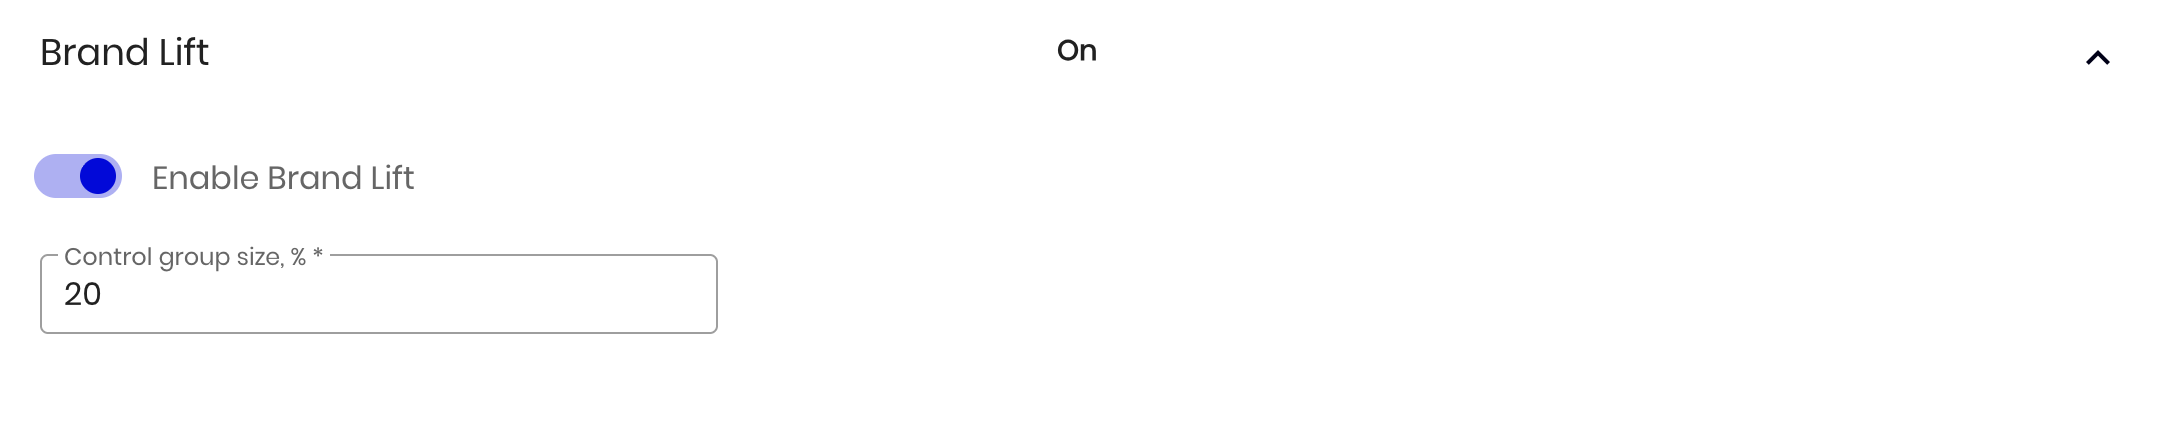
NT DSP automatically creates two groups in Audiences. If you set the control group to 20%, the platform splits users who meet your campaign’s targeting criteria into the following groups.
- _BRAND_LIFT_INCLUDE_ – the 80% of users who are eligible to see your campaign ads.
- _BRAND_LIFT_EXCLUDE_ – the 20% of users who are excluded from seeing your campaign ads. This is the control group.
Both audiences grow as the campaign runs. When an audience reaches the required size, its status updates in Audiences.
2. Prepare your survey banner
Use the same HTML5 banner for both audiences, with the same question and answer options. For example, to measure brand awareness, you could ask “Have you heard of Brand X?”
To record survey responses in NT DSP, set up a separate event for each answer option in the banner code. Each event should fire when a user selects the corresponding answer.
| Answer option | Example event code |
| Yes | answer_yes |
| No | answer_no |
| Not sure | answer_unknown |
When you upload the HTML5 creative to NT DSP, add these events to the creative.
1. Open Events and click New.
2. Select the event type and give the event a name, such as Answered Yes.
3. In Event Code, enter the variable name from the banner code. For the “Yes” option in this example, enter answer_yes.
4. Add an event for each remaining answer option and save your changes.
The event code in NT DSP must match the variable name in the banner exactly. Use only lowercase Latin letters and underscores. For details, see section 5 of the Banner Creative guide (in Russian).
3. Launch the survey for both audiences
Once both audiences reach the required size, create a separate survey campaign with two creative groups. Add the same survey banner to both groups. For each creative group, select the corresponding audience from the main campaign.
1. For the first creative group, select _BRAND_LIFT_INCLUDE_.
2. For the second creative group, select _BRAND_LIFT_EXCLUDE_.
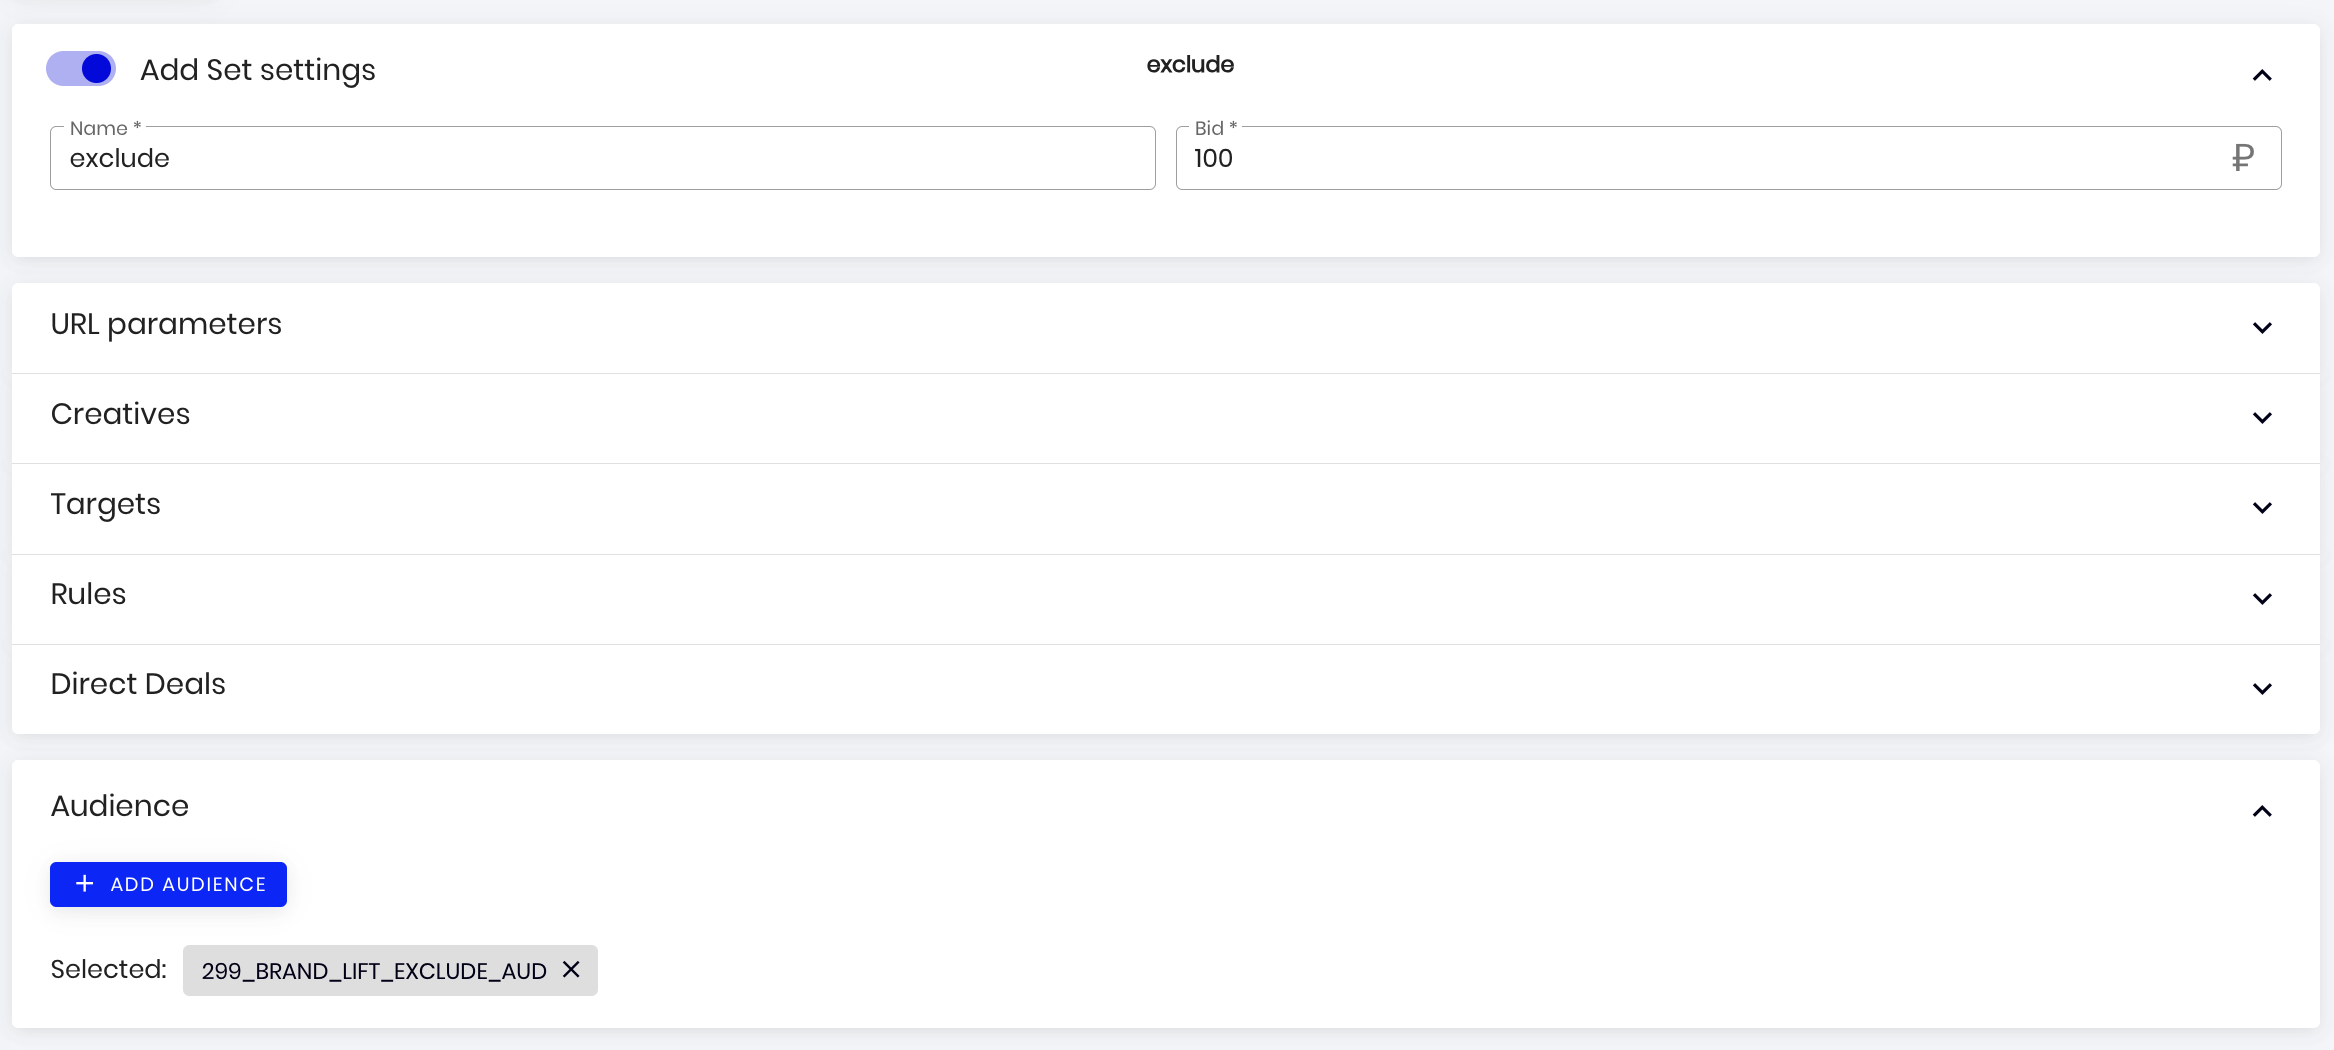
Launch the survey campaign. Responses appear in NT DSP statistics as banner events. Track the response count for each group separately. Aim for at least 500 responses per group, ideally 1,000 or more per group.
4. Download the report and compare the results
Once both groups have collected enough responses, download the report from Statistics. For each answer option, calculate the percentage of respondents in each group who selected it. Use the total number of responses in that group as the denominator.
For example, suppose 35% of respondents in the include group and 30% of respondents in the control group answered “Yes” when asked whether they had heard of Brand X.
Absolute Brand Lift is the difference between the two percentages. In this example, 35% − 30% = 5 percentage points.
Relative Brand Lift expresses that difference as a percentage of the control group’s result. In this example, (35% − 30%) / 30% × 100% ≈ 16.7%.
Before drawing conclusions about the impact of your campaign, check whether the difference between the groups is statistically significant.