The Overview section displays key metrics for a selected period. Here you can customize the statistic blocks to get up-to-date information on your active campaigns. To do this, simply select the necessary blocks by ticking the checkboxes.
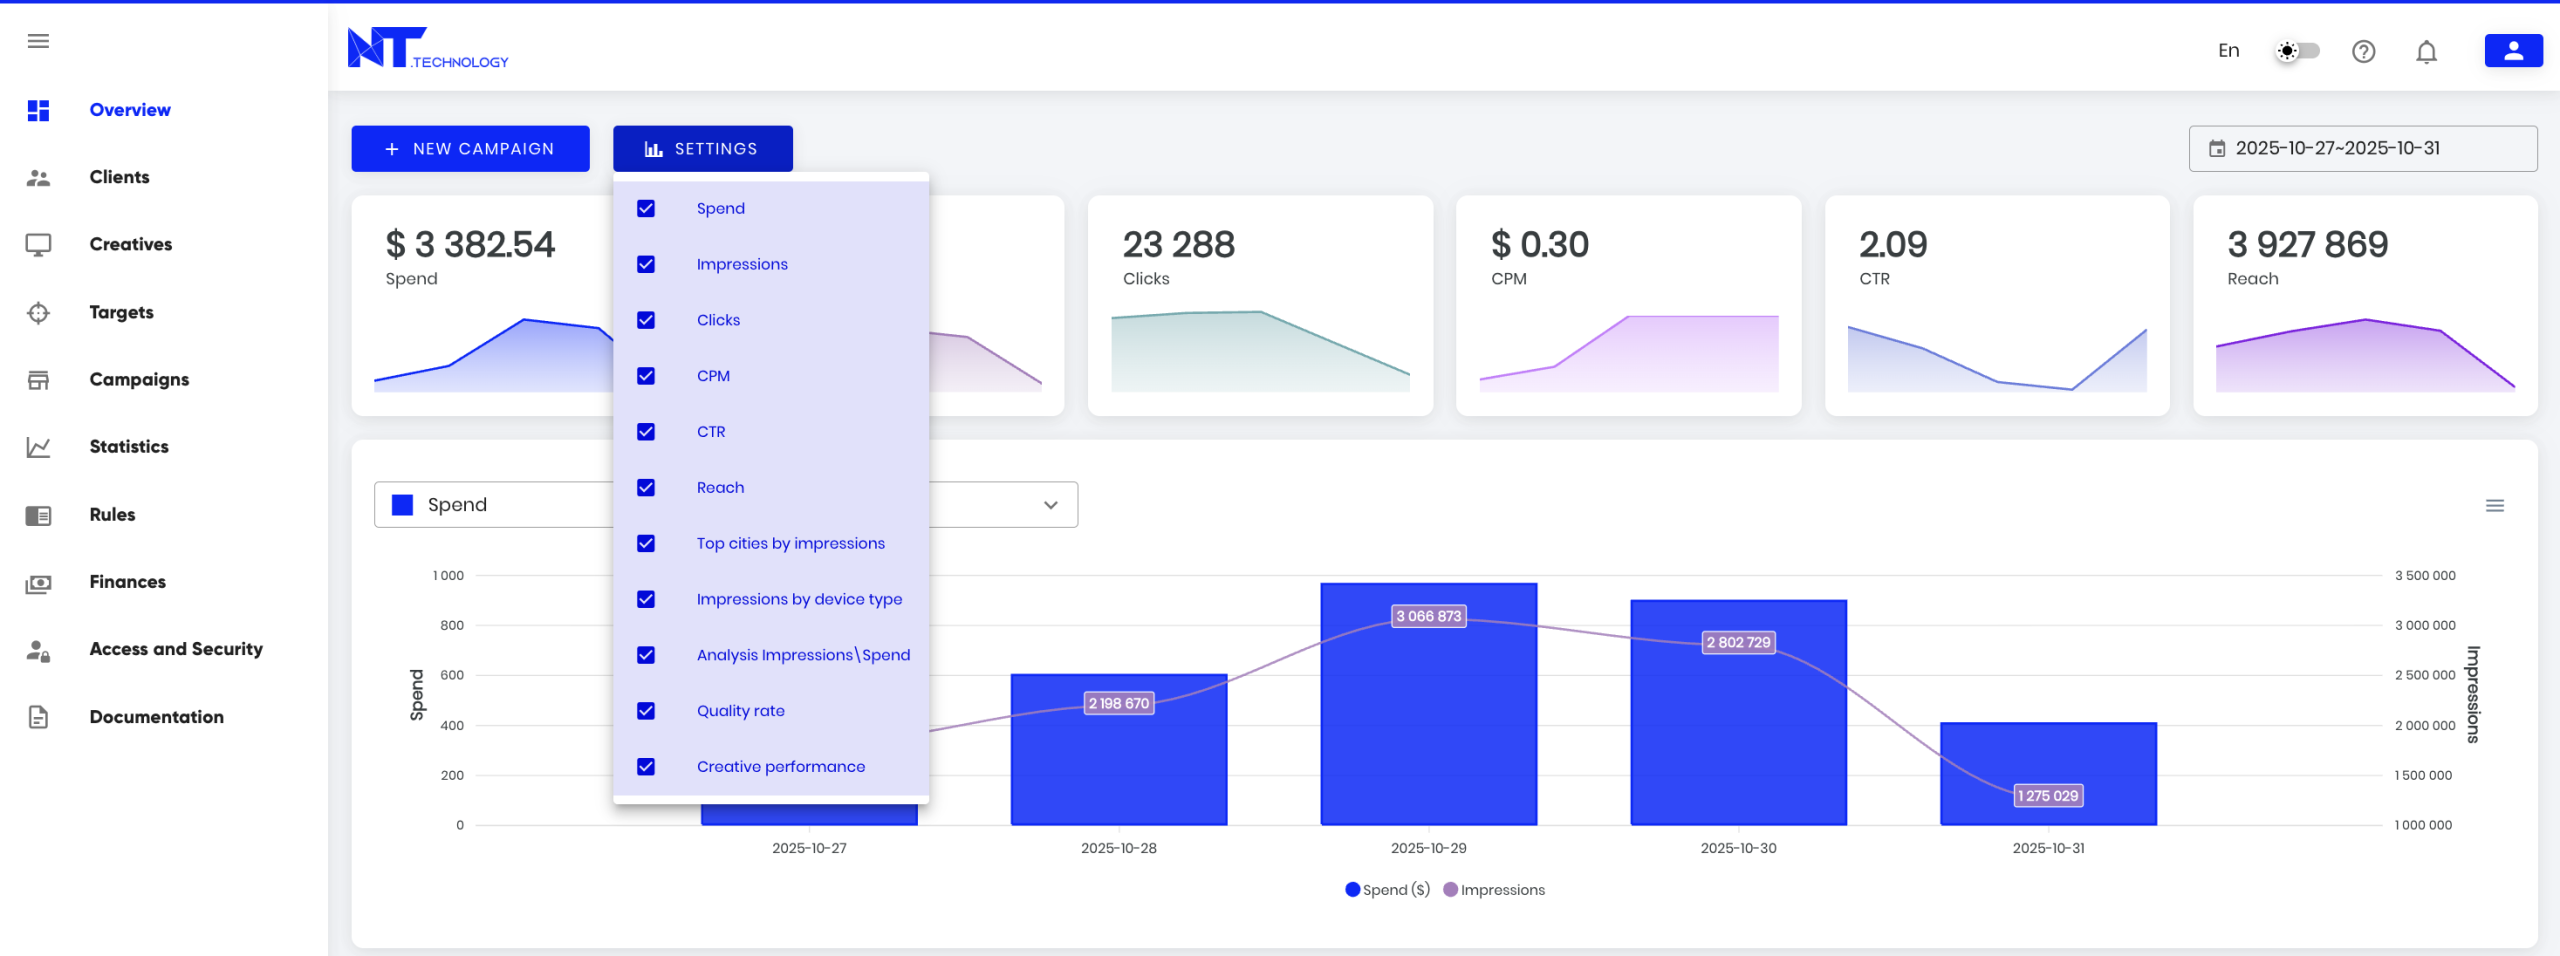
Below is a detailed description of each dashboard block.
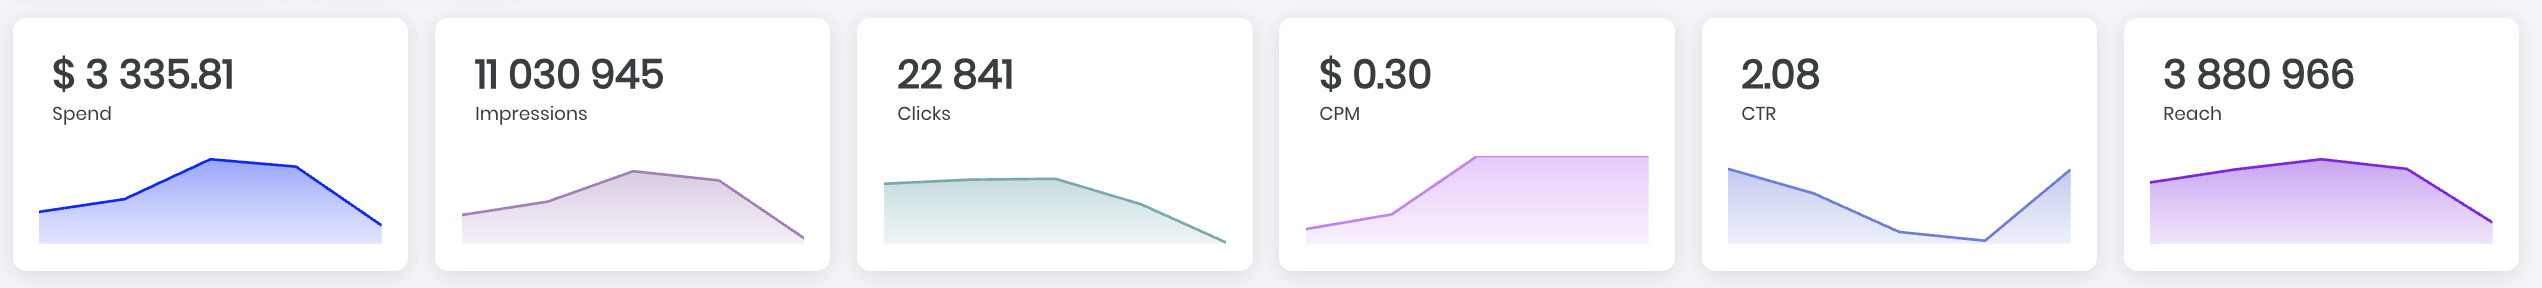
Block 1: Campaign Performance Dynamics for the Selected Period
- Total Spend
- Number of Impressions
- Number of Clicks
- Average CPM
- Average CTR
- Reach
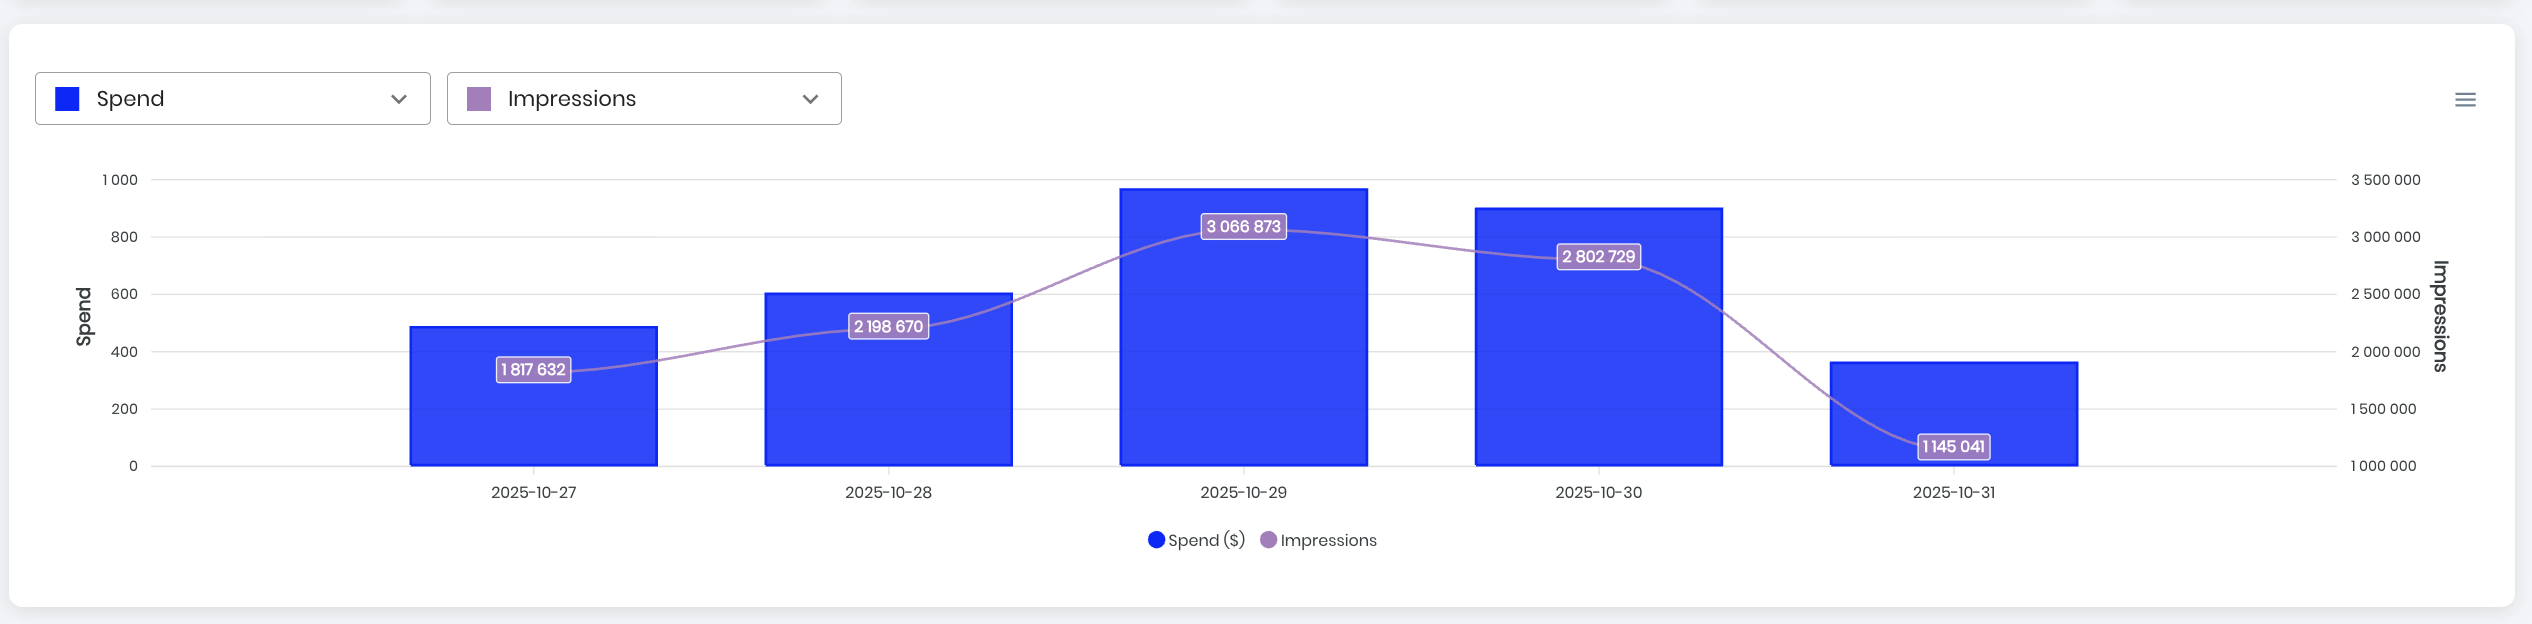
Block 2: Customizable Chart for Comparing Metrics
Compare various performance indicators such as Spend, Impressions, Clicks, CPM, CTR, and Reach. Data is displayed in the contract currency. The chart can be downloaded in .svg, .png, or .csv format via the chart side menu.
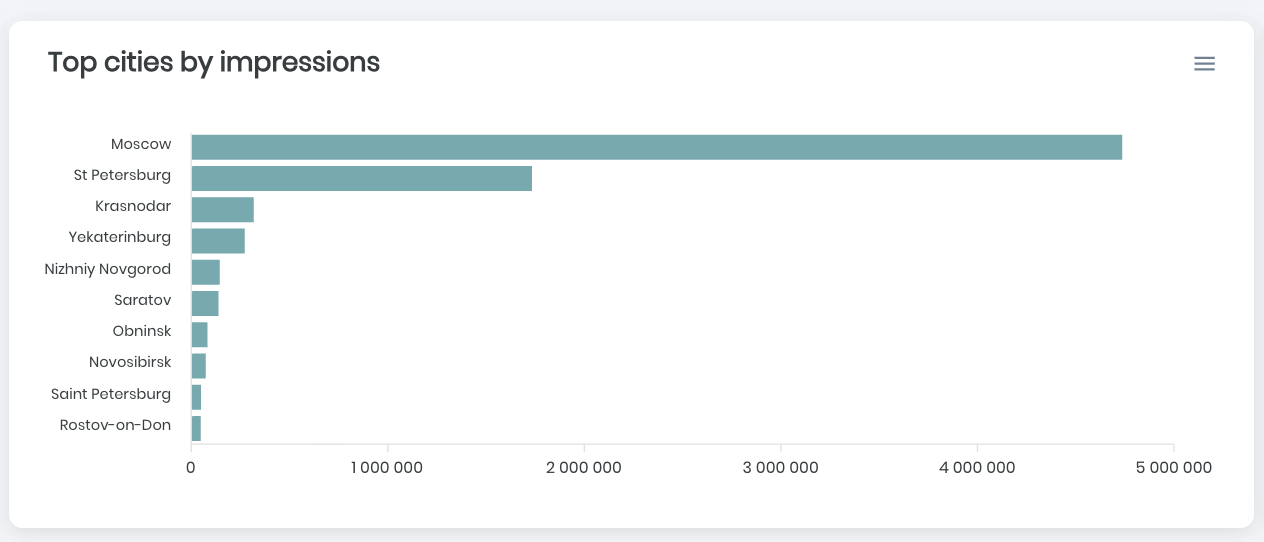
Block 3: Top Cities by Impressions
Data is based on active campaigns. The chart can be downloaded in .svg, .png, or .csv format via the chart side menu.
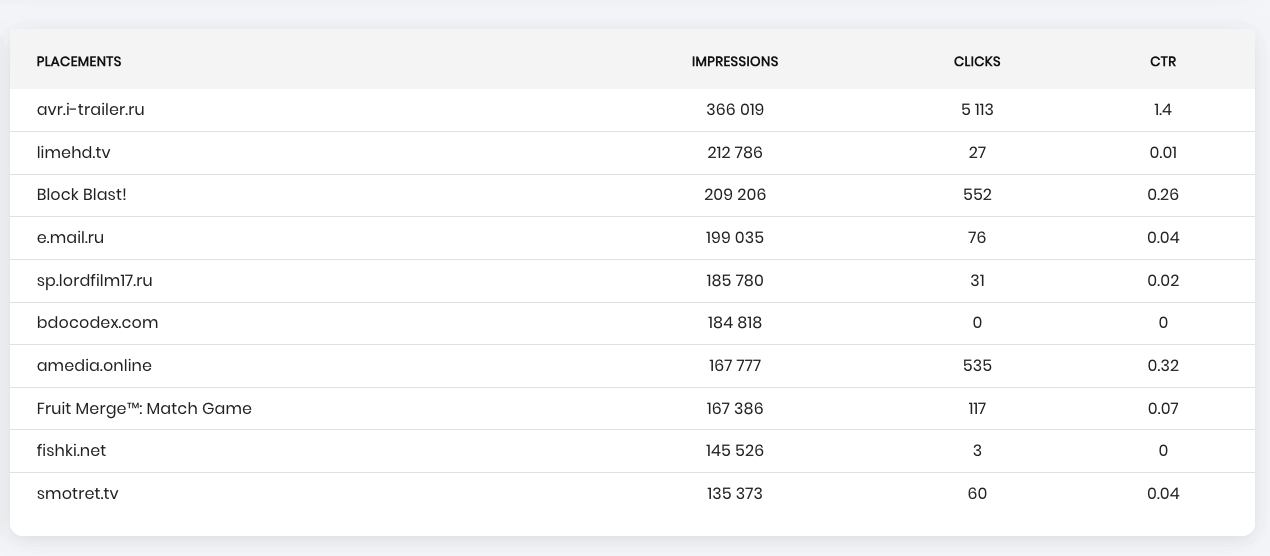
Block 4: Placements
Displays the top sites by number of impressions for the selected period. Includes information on site name, number of impressions, clicks, and CTR.
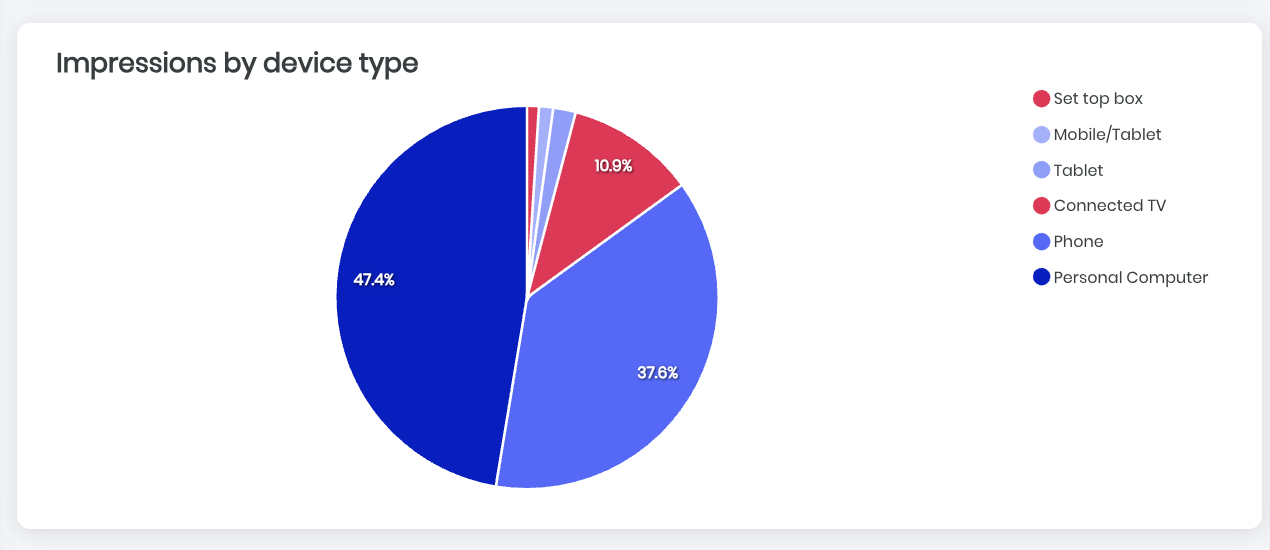
Block 5: Device Types
Shows the percentage distribution of devices on which ads were displayed (tablet, phone, PC, CTV, etc.).
Block 6: Campaigns
Provides details on active campaigns for the selected period, including the number of clicks, impressions, CTR, and total spend for each campaign.